MongoDB World’17 #MDBW17

MongoDB World 2017 (MDBW17) was amazing. You know, it is a conference with a marketing vies, but there are conferences and conferences.

MongoDB has been innovating on the database market since it has been born, but they made crystal clear at MDBW17 that a new milestone was achieved.

I’m pretty sure that the features they released and the ones that they are about to release on MongoDB 3.6 will change the way we create and deploy applications.

Let’s see if I can summarize all the cool stuff on this post.

MongoDB Advocacy Summit

Being part of the MongoDB Advocacy community is an awesome thing. We have been always in touch with each other virtually, and some of them have already met in person, but this year was special for me. I have the opportunity to meet my Advocate buddies in person.

The day was divided in two parts:

  • During the morning: roadmap overview presented by Eliot Horowitz(CTO and Co-founder), Dan Pasette (VP of Core Engineering), Sahir Azam (VP of Cloud Products and GTM), Michael Cahill (Director of MongoDB Storage Engines) and Asya Kamsky (Lead Product Manager)
  • Afternoon: unconference format. Here is how it works. People attending the summit either suggests or vote on subjects that they would like to discuss. Then, the three most voted subjects are spread across the room and people can choose which subject they want to join on a discussion creating three discussion groups. Each group has a volunteer to take notes and at the end each group summarizes the takeaways of each subject.

It was a very productive day. I’ve learned a lot from other Advocates.

Francesca Krihely, Jay Destro and Meghan Gill made an outstanding work putting the Advocate community together on Monday. Thanks guys! It was amazing.

mdbadvocacysummit01

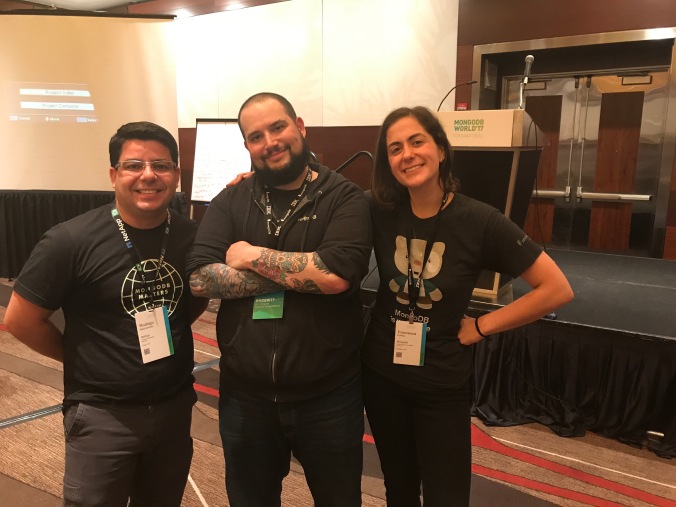
Left to right: Logwriter, Jay Destro and Francesca Krihely

A New World of Possibilities Unleashed by MongoDB

Are you ready? Tons of new features and services were announced during the Keynote session.

Two announcements were shining on stage: MongoDB Stitch and MongoDB Charts.

MongoDB Stitch is a Backend-as-a-Service offer that promises to let developers focus on building application instead of service integration and backend infrastructure.

mdbstitch02

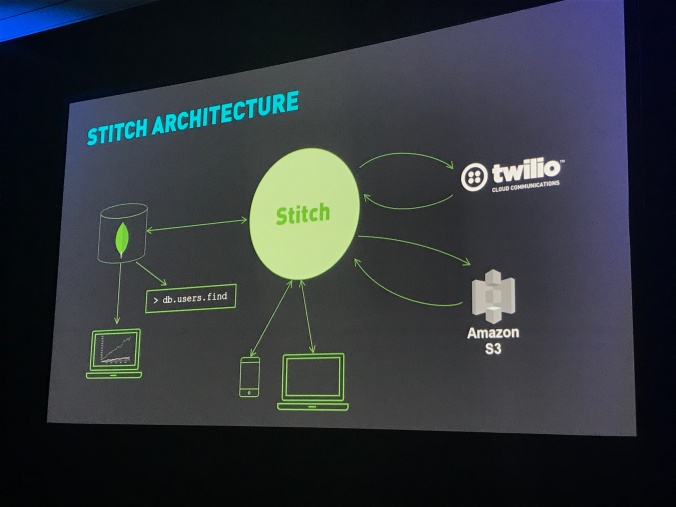
MongoDB Stitch Architecture Diagram

Described by Eliot Horowitz as a REST API for MongoDB and a service composition tool anywhere you want.

Definitely a candidate for a future post as soon as I learn it in more depth.

MongoDB Charts is a BI tool, which connects on ATLAS and allows you to explore and visualize your data using charts. My understanding was that is only available for ATLAS, but I have to double check that.

mdbcharts02

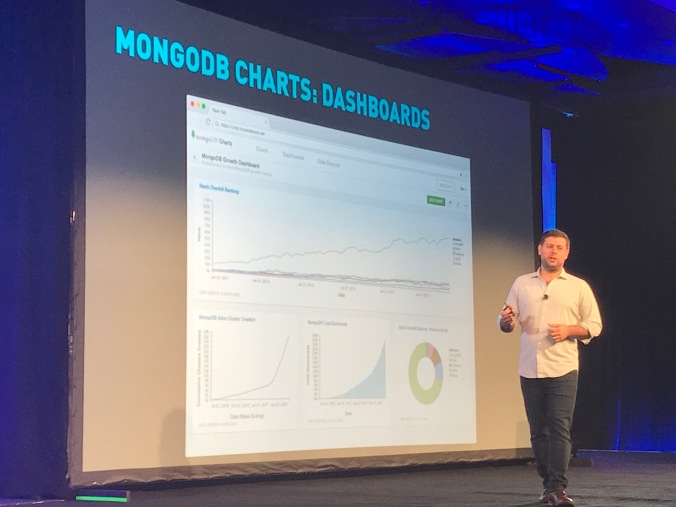
MongoDB Charts Dashboard

MongoDB ATLAS has completed one year since it was launched at MDBW16 and it’s been a successful DBaaS solution.

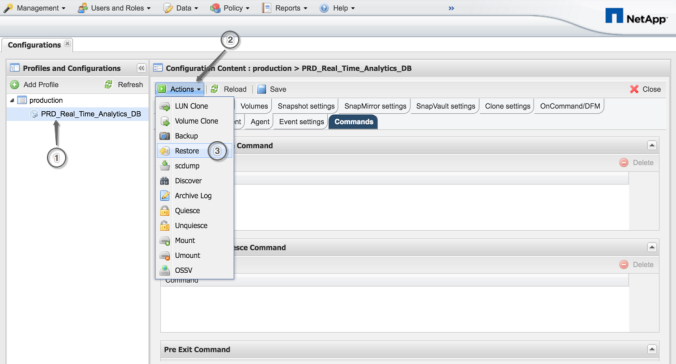
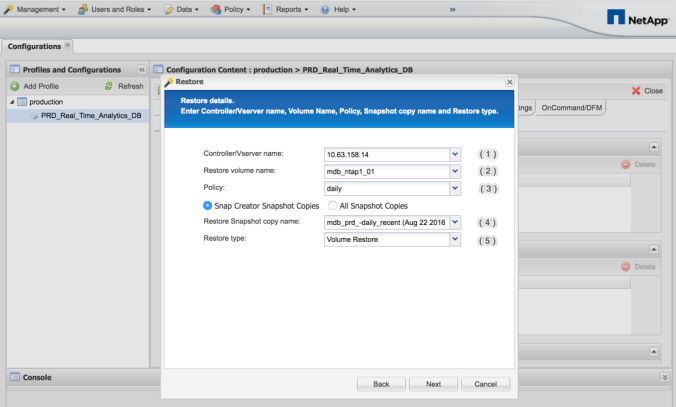
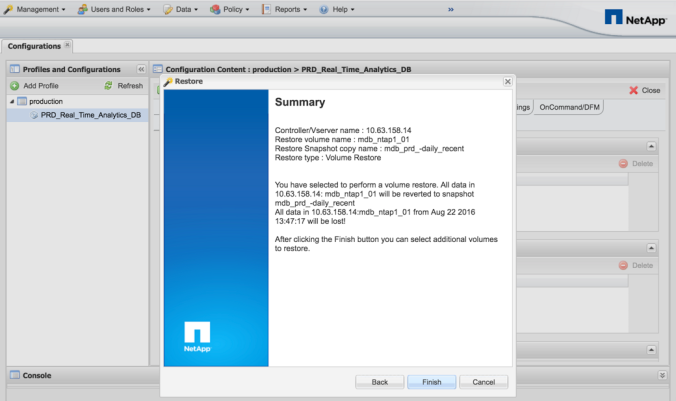
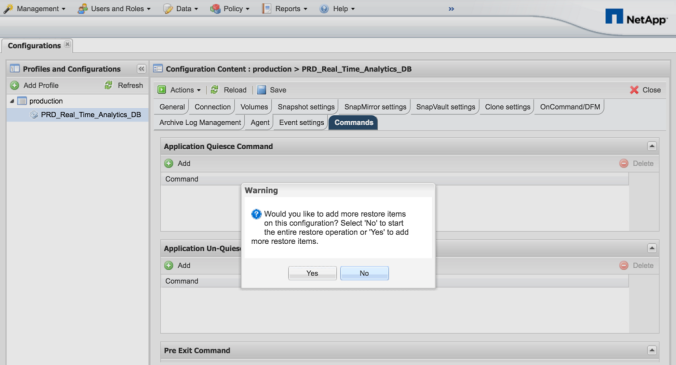
MongoDB 3.6 will bring interesting improvements such as retryable writes, notification API, better array manipulation, improvements in the aggregation framework and schema validation using a JSON.
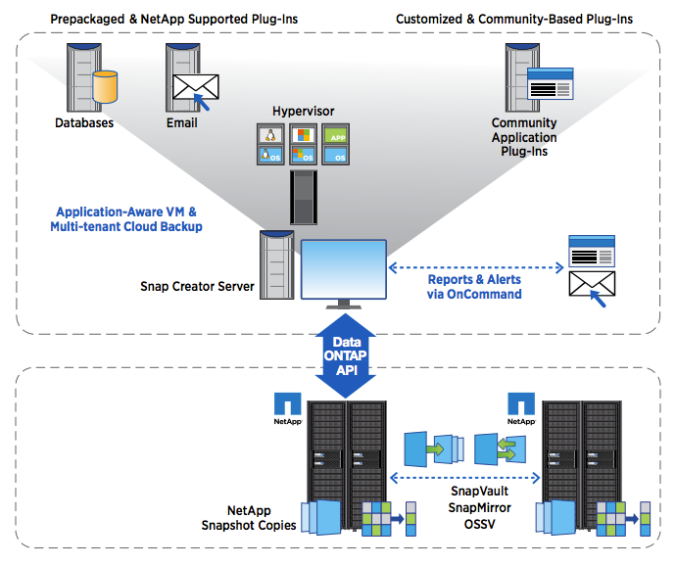
NetApp Booth

NetApp was a platinum sponsor for MDBW17. You might be question yourself: “What a data storage company like NetApp is doing at MDBW17?”.

The first thing it might come to your mind would be: “Databases have to persist data on disk. NetApp sells data storage systems. Bingo!”.

Well, NetApp isn’t only a data storage company. We’ve reinvented ourselves as a company and became a data management company. Our solutions are much more than data storage systems. Click here to get more information about NetApp or if you have any specific questions, leave comment on this post and I will get back to you.

netappbooth01

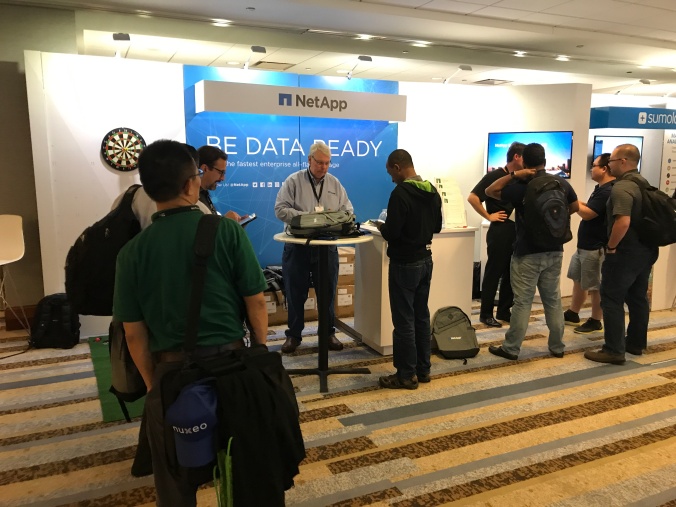
NetApp Booth at MDBW17

Thanks for reading it and let me know if you have any questions.

See you next post!

Logwriter


It might happen to you anytime: Be ready! profiling, analyzing and creating indexes to support your App

Hi Everyone,

Logwriter here! How are you?

Usually when you are a Developer/DBA, you probably have a tied control of what queries your application does against the database and you kinda know which indexes will be necessary to support the queries.

But I bet that a lot of us working in the enterprise companies have the Developer/DBA role splitted because of the organization. So, you’re a DBA or you’re a Developer.

When that is the case and you’re the DBA, doesn’t matter how many times you’ve attended to SCRUM meetings with the Developer team, they will create a new feature that is querying data without an index. If this situation has never happened to you:

  • You are lucky guy, but there is always a first time for everything in life
  • Feel free to stop reading here if you don’t believe that it will never happen with you

It’s a wonderful day, you’re working in your comfy chair and all of a sudden you get a ticket about performance issues in the application forwarded by the application team to you. Of course my friend, the application team will always blame the database (they are supposed to do that, is their mission in life).

Users are complaining about slowness in the app when accessing/filtering cities per population sizes.

How you will find out what is happening?

One approach could be turning on database profiling:

> db.setProfilingLevel(1,10)
{ "was" : 0, "slowms" : 100, "ok" : 1 }

Right after the execution of the above command, you have a new collection in your database known as “system.profile”.

> show collections
system.profile
zips

Any operation that exceeds 10ms will be recorded in the system.profile collection.

note1: let’s assume that 10ms is the ceiling of acceptable latency for my app. Just because I don’t have a humongous database here.

I’m a lucky guy and the issue just happened and was recorded in the system.profile collection. So, analyzing the output:

> db.system.profile.find().pretty()
{
 "op" : "getmore",
 "ns" : "postal.zips",
 "query" : {
 "getMore" : NumberLong("25579730777"),
 "collection" : "zips"
 },
 "originatingCommand" : {
 "find" : "zips",
 "filter" : {
 "pop" : {
 "$gt" : 12000
 }
 }
 },
 "cursorid" : 25579730777,
 "keysExamined" : 0,
 "docsExamined" : 29178,
 "cursorExhausted" : true,
 "numYield" : 228,
 "locks" : {
 "Global" : {
 "acquireCount" : {
 "r" : NumberLong(458)
 }
 },
 "Database" : {
 "acquireCount" : {
 "r" : NumberLong(229)
 }
 },
 "Collection" : {
 "acquireCount" : {
 "r" : NumberLong(229)
 }
 }
 },
 "nreturned" : 6751,
 "responseLength" : 681209,
 "protocol" : "op_command",
 "millis" : 12,
 "planSummary" : "COLLSCAN",
 "execStats" : {
 "stage" : "COLLSCAN",
 "filter" : {
 "pop" : {
 "$gt" : 12000
 }
 },
 "nReturned" : 6852,
 "executionTimeMillisEstimate" : 11,
 "works" : 29469,
 "advanced" : 6852,
 "needTime" : 22616,
 "needYield" : 0,
 "saveState" : 231,
 "restoreState" : 231,
 "isEOF" : 1,
 "invalidates" : 0,
 "direction" : "forward",
 "docsExamined" : 29467
 },
 "ts" : ISODate("2017-04-12T00:39:53.808Z"),
 "client" : "127.0.0.1",
 "appName" : "MongoDB Shell",
 "allUsers" : [ ],
 "user" : ""
}
> 

I highlighted the fields that I believe that are important for this troubleshooting.

Q: Which collection has been reported with an operation that exceeds 
the 10ms threshold?
A: zips.
"ns": "postal.zips"
Q: Which operation has exceeded the 10ms threshold? 
A: getmore.
"op": "getmore"
Q: Which command has been executed?
A: find command, using a filter where the field pop should be greater
than 12000.
"originatingCommand" : {
 "find" : "zips",
 "filter" : {
 "pop" : {
 "$gt" : 12000
 }
Q: How long was the execution of this command?
A: 12ms.
"millis" : 12
Q: Was this query supported by an index?
A: No, it wasn't. The query planner has pointed that this query is a
collection scan. 
"planSummary" : "COLLSCAN"
Q: How many documents were examined and how many were returned?
A: All documents in the collection (29,467) were examined and 
6,852 were returned.
"docsExamined" : 29467
"nReturned" : 6852

Since we have what we were looking for let’s disable the database profiling:

> db.setProfilingLevel(0)
{ "was" : 1, "slowms" : 10, "ok" : 1 }
> db.system.profile.drop()
true
>

OK, there is one treat here: COLLSCAN. How do we avoid a collection scan? Creating an index to support the query.

The application is executing a query filtering on the field “pop”, so let’s create an index to support this query:

> db.zips.createIndex( { "pop": 1 } )
{
 "createdCollectionAutomatically" : false,
 "numIndexesBefore" : 1,
 "numIndexesAfter" : 2,
 "ok" : 1
}
>

Index has been created, but how can I check if the execution time has been improved by the index?

Let’s create an explainable object and try the same query as the application:

> var execplan = db.zips.explain("executionStats")
> execplan.find( { "pop": { $gt: 12000 } } )
{
 "queryPlanner" : {
 "plannerVersion" : 1,
 "namespace" : "postal.zips",
 "indexFilterSet" : false,
 "parsedQuery" : {
 "pop" : {
 "$gt" : 12000
 }
 },
 "winningPlan" : {
 "stage" : "FETCH",
 "inputStage" : {
 "stage" : "IXSCAN",
 "keyPattern" : {
 "pop" : 1
 },
 "indexName" : "pop_1",
 "isMultiKey" : false,
 "multiKeyPaths" : {
 "pop" : [ ]
 },
 "isUnique" : false,
 "isSparse" : false,
 "isPartial" : false,
 "indexVersion" : 2,
 "direction" : "forward",
 "indexBounds" : {
 "pop" : [
 "(12000.0, inf.0]"
 ]
 }
 }
 },
 "rejectedPlans" : [ ]
 },
 "executionStats" : {
 "executionSuccess" : true,
 "nReturned" : 6852,
 "executionTimeMillis" : 8,
 "totalKeysExamined" : 6852,
 "totalDocsExamined" : 6852,
 "executionStages" : {
 "stage" : "FETCH",
 "nReturned" : 6852,
 "executionTimeMillisEstimate" : 10,
 "works" : 6853,
 "advanced" : 6852,
 "needTime" : 0,
 "needYield" : 0,
 "saveState" : 53,
 "restoreState" : 53,
 "isEOF" : 1,
 "invalidates" : 0,
 "docsExamined" : 6852,
 "alreadyHasObj" : 0,
 "inputStage" : {
 "stage" : "IXSCAN",
 "nReturned" : 6852,
 "executionTimeMillisEstimate" : 10,
 "works" : 6853,
 "advanced" : 6852,
 "needTime" : 0,
 "needYield" : 0,
 "saveState" : 53,
 "restoreState" : 53,
 "isEOF" : 1,
 "invalidates" : 0,
 "keyPattern" : {
 "pop" : 1
 },
 "indexName" : "pop_1",
 "isMultiKey" : false,
 "multiKeyPaths" : {
 "pop" : [ ]
 },
 "isUnique" : false,
 "isSparse" : false,
 "isPartial" : false,
 "indexVersion" : 2,
 "direction" : "forward",
 "indexBounds" : {
 "pop" : [
 "(12000.0, inf.0]"
 ]
 },
 "keysExamined" : 6852,
 "seeks" : 1,
 "dupsTested" : 0,
 "dupsDropped" : 0,
 "seenInvalidated" : 0
 }
 }
 },
 "serverInfo" : {
 "host" : "brbrain",
 "port" : 27017,
 "version" : "3.4.0-rc3",
 "gitVersion" : "7d68067e5a6272bb463acc4e7a6c6a144148039c"
 },
 "ok" : 1
}
> 

Not going on too much detail here, but no more COLLSCANs, now the query is supported by the index ( “stage” : “IXSCAN”).

The number of examined and returned documents are the same, indicating a returned per examined documents rate of 1 which is an excellent thing to have. (“nReturned” : 6852, “totalDocsExamined” : 6852).

The execution time came down to 8ms (“executionTimeMillis” : 8).

Database profiling is an powerful tool that can be used to identify which indexes can be created in your collection to improve execution times.

It’s a simple example, but I believe that you got the idea, right? 🙂

Thanks for reading it and let me know if you have any questions.

See you next post!

Logwriter

MongoDB Data Protection on NetApp All Flash FAS

Hi All,

Logwriter here! How are you?

I just want to make a quick post to share 3 videos about MongoDB Data Protection on NetApp All Flash FAS (AFF).

I hope you can get an idea how quicker and easier your backup/restore process can be if you have your MongoDB database on NetApp.

Backup
Demonstrating how fast, easy and non-disruptive is the process of backup a MongoDB database using NetApp snapshots
Link: https://www.youtube.com/watch?v=tPl35B4KmFs&t

Restore
Demonstrating how to restore a ~700GB MongoDB database in seconds with SnapRestore and at the end applying the database operation log to bring the database to the most up-to-date position before the disaster.
Link: https://www.youtube.com/watch?v=EsFJ_tqOWXM

FlexClone
Customer is running MongoDB 3.2.11 on the production environment. He would like to test MongoDB 3.4.2 without upgrade the production system. Using flexclone to create a dev/test environment where customer will have the chance to test MongoDB 3.4.2
Link: https://www.youtube.com/watch?v=7oCsw1On3ts

Thanks for reading and see you next post!

Logwriter

Making NetApp ONTAP Deployment Easier

Hi Everyone,

Logwriter here! How are you?

It is another day in the office and I just got a new gear for my performance testing project. Every time I have a new project I need to deploy an ONTAP cluster. It means I have to create aggregates, volumes, LUNs, LIFs, igroups, etc. I also need to create a kind of documentation about how the storage was deployed for the performance testing project.

If it is a recurring task, why not automate it?

I’ve started a personal project that I’ve named as “NetApp Fast Deployment Tool”. Basically, you define your storage deployment in a JSON file and this tool will deploy the environment for you.

One of my current projects is an Oracle Performance Testing on a new NetApp AFF platform. It is an Oracle RAC deployment with 6-nodes, on the NetApp side I have 1 SVM, protocol is FCP,  8 FCP LIFs, 6 igroups (one per RAC node), 20 Volumes and 20 LUNs. This config was deployed in 1 minute.

At the end, my JSON file will work as a documentation about how the storage has been deployed.

You can see a video of the tool in action here. The storage deployment is for a MongoDB environment.

[ WARNING ]  — progressive metal rock as background song, turn down your speaker volume (or turn it up)

How to Install

  1. Download it from GitHub:
  2. Download the NetApp Manageability SDK (NMSDK) for all platforms from NetApp support web site:
  3. Uncompress the NMSDK and copy the python libs NaElement.py and NaServer.py to the netapp-fast-deploy lib directory:
    • cd netapp-manageability-sdk-5.6/lib/python/NetApp
    • cp NaElement.py <NETAPP_FAST_DEPLOY_DIR>/lib
    • cp NaServer.py <NETAPP_FAST_DEPLOY_DIR>/lib

How to Use it

You will find out the instructions about how to use this tool at the GitHub repository page.

Go Further, Faster

If you like it and start using it, I would like to ask you a favor. If you find a bug, please open an issue here. I’ve started this tool to improve my time on my daily tasks, but I’m completely open to add new features and fix possible bugs that you might find on it.

Thanks for reading it and let me know if you have any questions.

See you next post!

ONTAP and MongoDB Working Together – Episode 1

Hi All,

Logwriter here! How are you?

Let me start this post with a question:

How many times have you attended to a meeting where someone has demonstrated a product or solution that solves all issues in the world, but not yours?

I’ve attended to some of those meetings and I didn’t enjoy any second of meetings like that and I know how boring they can be.

With that in mind, I’ve decided to blog about real user issues. In case of MongoDB, I will get my user stories from the mongodb community. My sources will be: mongodb user group and mongodb advocacy hub.

Quick introduction about NetApp ONTAP for those that haven’t heard about it. ONTAP is the operating system that runs on NetApp All Flash FAS Series and FAS Series storage systems. You can find more information about here.

That said, let’s go for our first real user issue. Just to make it friendly, let’s use a JSON notation to describe it here:

{
subject”    : “Mongo dump and restore shows drastically different db.stats()”,
question” : “I run a mongodump of our database every night.When I did a restore to a totally separate replica set the sizes are drastically different. I’m gathering that this is probably normal, but looking for a little more confirmation from the community.”,
source”     : “https://groups.google.com/forum/#!topic/mongodb-user/8MF4Tku8wnI&#8221;
}

According to this user, his production database has 96 collections. He got a mongodump from the production database and ran a mongorestore in a different server. It turned out that after mongorestore was done, he ended up with only 95 collections restored.

There isn’t any log file from the server where the mongorestore was done, but regardless of the reason of why mongorestore didn’t bring all collections in the restore operation, if this environment was running on a NetApp AFF/FAS System your backups would be done using ONTAP Snapshots and a restore on a different server would be done using a FlexClone.

I’ve blogged before about NetApp Snap Creator Framework and backing up a MongoDB database, check it out here.

If you want to know how would be the restore process and how long it takes to restore a 1 TiB  database, I also have blogged about it check it out here.

By the way, NetApp will be presenting a session at MongoDB Europe16. Paul Mu, Technical Director at NetApp and Mohinder Toor, Business Development Executive EMEA, will be talking about Deploying MongoDB on NetApp Storage. Check the schedule here and attend to their session to learn how NetApp can help you to improve your MongoDB infrastructure.

Please, let me know if you have any questions and see you next post!

Thanks for reading it!

Logwriter

NetApp Simulator Lab

Hi All,

Logwriter here! How are you?

My friend Neil Anderson from FlackBox has done an amazing job putting together a guide to build a NetApp Lab using ONTAP Simulator.

netappsim_ebook

Neil has capture every screenshot of every step needed to have an up and running NetApp Simulator Lab and everything is documented in his ebook. The ebook is available for free and you can download it here.

Let me know if you have any questions and see you next post.

Thanks for reading it!

All the best,

Logwriter

MongoDB Deployment Tips on NetApp All-Flash FAS Systems – Part 4

featured_image_mongodb_series

Hey All,

Logwriter here! How are you?

Evaluating storage efficiency isn’t an easy task. In my opinion, the hardest part is to choose a dataset that best represents a real system.

For example, I wouldn’t say that measuring storage savings from YCSB (Yahoo Cloud Serving Benchmark tool) dataset is the best thing to do, unless your data set looks like an YCSB data set.

The Data Set

For my testing I’ve decided to use a public data set. I found a public data set from Reddit. It’s a data set with public comments from May and June 2016. It is a single collection with 131,079,747 documents. Figure 1 shows a sample document and its fields.

part4_doc_sample

Figure 1. Sample document

The data was ingested to MongoDB using the command: mongoimport

MongoDB Cluster Topology

I have a MongoDB cluster made of a single Replica Set. My Replica Set has 3 members: 1 Primary, 1 Secondary and 1 Arbiter.

It means that the Primary has a copy of the database and he handles requests of reads/writes to it.

Secondary has also a copy of the database that is sent by the primary (replication).

Arbiter is a member that helps to elect a new primary in case of the failure of the current primary.

part4_mdb_cluster_diagram

Figure 2. MongoDB Cluster Topology

WiredTiger (WT) Compression

WiredTiger (WT) is the default storage engine for MongoDB 3.2. It’s completely different compared to MMAPv1. It delivers document level concurrency and it stores data in a more efficient way then MMAPv1 because it supports compression.

You can choose between two different compression libraries: snappy or zlib.  The default is the snappy lib.

Snappy is a data compression/decompression library written by Google. Further information about it here.

Zlib is a data compression/decompression library written by Jean-loup Gailly and Mark Adler. More info about it here.

All-Flash FAS (AFF) Storage Efficiency

ONTAP 9.0 data-reduction technologies, including inline compression, inline deduplication, and inline data compaction, can provide significant space savings. Savings can be further increased by using NetApp Snapshot® and NetApp FlexClone® technologies.

ONTAP 9.0 has introduced a new storage efficiency technique known as “inline data compaction”. It gets more than 1 logical block and if possible, stores them in a single physical 4KB block.

Let’s say your NetApp AFF running ONTAP 9.0 gets the following write requests:

part4_objpack_01

Figure 3. Example of Write Requests to the storage system.

How these write requests will be handled by inline compression and inline compaction? Take a look on Figure 4.

part4_objpack_02

Figure 4. ONTAP 9.0 inline compression and inline compaction.

In this example, after it breaks the requests in WAFL blocks (4KB blocks) it would need 11 blocks to store the data. Applying inline adaptive compression, the number of required blocks to store the data goes down to 8 blocks, and finally after inline data compaction the data is stored in 4 physical disk blocks.

Which Storage Efficiency Technology I Should Use on My Environment?

I hate to answer a question like that with: “It depends.”, but unfortunately this is the real answer. Let me walk you through the process that has made me to conclude that “it depends”.

I’ve done 24 different tests using the Reddit public data set.

MongoDB has a parameter to control the on-disk page max size. The larger the value, the better will be your read performance in a sequential workload. The smaller the value, the better will be your read performance for a random workload. By default, leaf_page_max is set to 32K.

If we turn off all the efficiencies (in MongoDB and ONTAP) the Reddit data set has used 171GB of space.

Keeping leaf_page_max at the default, turning Compression on at MongoDB and turning efficiency off at ONTAP, the Reddit data set has used 88GB.

part4_wtcon_oseoff

Figure 5. WiredTiger Compression ON and ONTAP Efficiency OFF

WiredTiger compression is an on-disk feature, so it maintain compressed data on disk, but it doesn’t maintain compression on memory. So, you spend CPU time to compress the data before to send it to disk and when you need to read the data on disk to populate your cache you need to decompress the block and then make it available on cache.

ONTAP has been built to provide storage efficiency without impact the performance of your database. So, if you want to let ONTAP working on saving space for you, we need to change the leaf_page_max from 32K to 4K.

 Changing that setting, the Reddit data set has used 130GB. It is a little bit less saving than MongoDB, but your application will experience a consistent and predictable low latency.

part4_wtoff_oseon

Figure 6. WiredTiger Compression off and ONTAP Efficiency on.

Please, let me know if you have any questions and see you next post!

Thanks for reading it!

Logwriter

Checking what is going on at a glance

Hey All,

Logwriter here! How are you?

I should have published the 4th part of the series “MongoDB Deployment Tips on NetApp All Flash FAS Systems” today, but I wasn’t able to finish my test plan(which contains 3 scenarios to be tested). Comparing MongoDB WiredTiger compression feature with ONTAP Storage Efficiency is a time consuming task.

The 4th part of this series will be published September 13th, 2016.

I have committed to myself that I’m going to publish an article per week. So, I’ve decided to write about something that has been helping me to understand my MongoDB database during my testing: mongostat.

If for any reason, you’re not using MongoDB Cloud Manager or MongoDB Ops Manager to manage and monitor your MongoDB database, I bet you would like to understand mongostat’s ouput.

Of course mongostat doesn’t bring the same value as Cloud Manager or Ops Manager, but it can be useful to help you in understanding your workload characteristics in case of a real-time troubleshooting task.

Understanding mongostat output

Let’s pretend it is the first time I’m having access to this database and I want to understand what mongod is doing here.

The command: mongostat –host localhost –port 27100 1

  • –host: is your mongoDB database host
  • –port: is the port where mongod is listening
  • 1: is the refresh interval in seconds
mongostat

Figure 1. mongostat output.

At a glance I can tell you a few things about the workload, let me use the first line of values to comment about it:

  • insert column: there wasn’t any insert operations happening at the moment – 0 operations
  • query column: it’s a read intensive workload – 107,812 query operations
  • update column: it’s a few updates compared to the queries – 5,823 update operations
  • delete column: there wasn’t any delete operations happening at the moment – 0 operations
  • getmore column: database cursors weren’t busy – 0 operations
  • command column: There is one command per second – 1 command
  • % dirty column: There are 0.3% of dirty bytes in WiredTiger cache. It looks fine since the updates aren’t the majority of the operations – 0.3% dirty bytes
  • % used column: There are 1.9% of WiredTiger cache utilization. – 1.9% used
  • flushes column: Mongodb is flushing data to disk every second. In this case, it is working as expected since the parameter syncPeriodSecs is equal to 1 on /etc/mongod.conf – 1 flush per second
  • qr | qw column: qr (queue read) and qw (queue write); There 2 clients in the queue waiting for reading data and 0 clients in the queue waiting for writing data – 2|0
  • ar | aw column: ar (active read) and qw (active write); There 4 clients reading data and 1 client writing data – 4|1
  • netIn column: There are 10.4 megabytes of traffic received by mongod – 10.4m
  • netOut column: There are 222 megabytes of traffic sent by mongod – 222m

If you’re a storage admin, let me remind you that mongostat is reporting MongoDB counters and its point of view in the environment.

By that I mean, if you see 100,000 at query column it doesn’t mean you will get 100,000 read operations at the storage. The same thing for update, insert, or delete. It isn’t a 1 to 1 relationship.

I hope it helps you a little bit if you need to go over a mongoDB instance for the first time to understand what is going on, or if you have to troubleshooting any issue.

Please let me know if you have any questions and see you next post!

Thanks for reading it,

Logwriter


MongoDB Deployment Tips on NetApp All-Flash FAS Systems – Part 3

featured_image_mongodb_series

Hey All,

Logwriter here! How are you?

Here we go to Part 3 of MongoDB Deployment Tips on NetApp AFF Systems. At this part I’m going to show you how to restore your entire mongoDB replica set using NetApp Snap Creator Framework.

It’s a beautiful summer day, you’re at your desk playing with MongoDB Compass querying your database when all of sudden your connection to the database hangs and you’re trying to understand what is happening.

part3_server_exploding

Your entire ReplicaSet is gone… and your manager is probably going like this:

part3_make_it_stop

Luckily your database is running on a NetApp AFF System and it takes a snapshot each 15 min with a retention policy of 48 snapshots, which gives you 12 hours of snapshots to look back in the past if you need it. Of course I just put some numbers here, because the number of snapshots available to restore will completely depend on your RPO needs. In this example, your RPO would be 15 min.

After take a deep breath and ask your manager to calm down, you log in to your Snap Creator Framework and starts a restore operation following steps 1 through 3 as indicated by Figure 1.

part3_sc_restore_step00

Figure 1. Starting a Snap Creator Restore Operation.

After you click on “Restore” you will see a screen asking you 5 questions. All questions are listed on Figure 2. Basically, Snap Creator wants to know what volumes do you want to restore, which kind of restore you want to execute and which snapshot you want to use for restore.

Restore type, can be “Volume Restore” where all volume’s content will be reverted to the state as it was when the snapshot was taken. Or it can be “Single File Restore” where you can choose which files/LUNs you want get reverted to the state as it was when the snapshot was taken.

I’m going with “Volume Restore” because my entire ReplicaSet is gone, so I want to revert all my servers to the same point in time.

part3_sc_restore_step01

Figure 2. Providing Snap Creator the information it needs to proceed with a restore.

Then you click “next” and you will see a summary screen as shown by Figure 3.

part3_sc_restore_step02

Figure 3. Snap Creator restore summary screen.

After click “Finish” I have only volume mdb_ntap1_01 as part of the restore job. Snap Creator will ask you if you want to add more volumes to this restore job as shown by Figure 4.

part3_sc_restore_step03

Figure 4. Adding more volumes to the restore job.

Clicking “Yes” and add all volumes that are part of your mongoDB replicaset. In my case here, I have volumes from mdb_ntap1_01 through mdb_ntap1_08, plus the arbiter’s volume mdb_ntap1_arbiter. After you’ve added all your volumes, click “no” and Snap Creator will show you a list of volumes that will be restored by this restore job as shown by Figure 5.

part3_sc_restore_step04

Figure 5. List of volumes that will be restored by the restore job.

Then you click “Ok” and after a few seconds your entire ReplicaSet is restored.

part3_sc_restore_step05

Figure 6. Restore Finished.

You are ready to rescan your LUNs if you will be using the same set of servers to bring your ReplicaSet up or if they were blown up like the gif in the beginning of this post, you can map your LUNs to another set of servers and then bring your Replica Set up and running.

I would like to highlight that the restore process took 25 seconds as you can see at Figure 7 and 8.

part3_sc_restore_log00

Figure 7. Restore has been started at 3:59:26 PM.

part3_sc_restore_log01

Figure 8. Restore was finished at 3:59:51 PM.


Figure 9 shows the database size.

part3_sc_restore_show_dbs

Figure 9. MongoDB database size.

So, my ReplicaSet is composed of 1 primary, 1 secondary and 1 arbiter. It means that if my database size is 1TB, the total data restored by Snap Creator was 2TB at 25 seconds. Pretty fast, BOOYAH!!

Please let me know if you have any questions and see you next post.

Thanks for reading it.

Logwriter

MongoDB Deployment Tips on NetApp All-Flash FAS Systems – Part 2

featured_image_mongodb_series

Hey All,

Logwriter here! How are you?

This post became longer than I was expecting, so I’ve decided to change the agenda of this series a little bit. At part two, you will see:

  • WiredTiger and Its Write Path
  • NetApp Snap Creator Framework
  • Creating Your MongoDB Profile and Configuration on Your Snap Creator Server

That said, let’s start it… I hope you enjoy it !

NetApp Snap Creator is the tool you want to use for backup, restore and clone operations with your MongoDB database.

part2_mdb_snapcreator

Figure 1. Snap Creator Login screen.

But before to jump into how to use Snap Creator, let’s see how WiredTiger handles write operations.

WiredTiger and Its Write Path

WiredTiger uses a MultiVersion Concurrency Control (MVCC) to handle write transactions. At the beginning of a write operation, WiredTiger provides a point in time version (aka snapshot) of the data that resides on disk. The snapshot is a representation of that data in memory.

When is time to write to disk, WiredTiger writes all the snapshot’s dirty pages into the datafiles in a consistent way. This process is called checkpoint.

By default checkpoints are made every 60 seconds. It can be modified changing the parameter syncPeriodSecs at /etc/mongod.conf.

But checkpoints aren’t enough to guarantee the durability of the data. Between checkpoints MongoDB protects your data using journaling.

A journal record is a representation of the operations that are happening with your data. For example, a document update might result in changes to an index, so WiredTiger creates a single journal record that contains the update operation and the necessary changes to the index.

By default, MongoDB syncs WiredTiger buffers with disks in the following events:

  • Every 50 milliseconds;
  • If a write operation occurs with write concern of j: true, WiredTiger syncs the journal files immediately;

The journal sync interval can be modified using the option commitIntervalMs, the minimum value is 1 and maximum value is 500.

You’re probably asking yourself “Why must I know about WiredTiger snapshot, checkpoint and journaling?”

You should know about these things to understand what will be in your backup as soon as you create one.

Through the Write Concern(j: true or j:false), MongoDB let’s the application determines the data’s level of importance, or better to say the durability of the data.

So, if your application is sending write operations with j: true, when you take a snapshot for sure all the operations acknowledge by mongod will be in your backup. But if your application is sending write operations with j:false, it isn’t guarantee that all operations acknowledge by mongod will be in your snapshot, because you don’t know if you’re taking a snapshot before or after the WiredTiger buffers being flushed to the journal files.

Note: You might be thinking about db.fsyncLock(), but according to MongoDB it is disruptive to your database. It will make mongod lock everything for write operations and it might affect reads. The connection that has started the lock must keep open to send the unlock, otherwise a hard shutdown (process kill) has to be done on mongod to unlock your instance.

NetApp Snap Creator Framework

Snap Creator is an unified data protection platform for multiple applications, databases and operating systems. It helps NetApp’s customers to address the following challenges:

  • Achieve application-consistent data protection
  • Standardize and simplify backup, restore and disaster recovery tasks in any environment
  • Become cloud ready by reducing the complexity of unique business processes and the development and management of scripts, helping you to make your backup, restore, and disaster recovery tasks more agile.

Let’s take a look on how Snap Creator works. It’s made of two main components: Snap Creator Server (scServer) and Snap Creator Agents (scAgent). Figure 2 gives you a better view how it looks like:

part2_mdb_snapcreator_dp_arch

Figure 2. NetApp Snap Creator Framework Data Protection Architecture

You need a VM or bare metal server to run your scServer. This VM or server needs to be able to reach out to your ONTAP cluster because it will be responsible to send the API calls to backup/restore or clone your application.

The scAgent goes in your application’s server. So, in our case here, the scAgent is installed on my MongoDB primary and secondary servers.

Creating your MongoDB Profile and Configuration on Your Snap Creator Server

To connect to your Snap Creator Server you just need a browser and then you point to your scServer IP on port 8443. The first time you login you will see the screen shown by figure 3.

part2_mdb_sc_welcome_screen

Figure 3. Snap Creator Welcome screen.

After click on “OK”, you will be redirected to the profile creation screen shown here by figure 4.

part2_mdb_sc_new_profile

Figure 4. Creating a new profile.

At this point I’m going to create a profile called “production”. Here I’m using the profile as the representation of my MongoDB production environment. After click on “OK” you will redirected to the configuration wizard as shown by figure 5.

part2_mdb_cfg_wiz_01

Figure 5. Snap Creator Configuration Wizard.

You need to give a name to your config. The name of my config is PRD_Real_Time_Analytics_DB.

part2_mdb_cfg_wiz_02

Figure 6. Configuration Name.

Snap Creator doesn’t have a specific plug-in for MongoDB, so at this screen you will select “None” as your plug-in type.

part2_mdb_cfg_wiz_03

Figure 7. Plug-in type selection.

After that, you need to inform the name or IP address where your scAgent is installed. In our case here, I’ve installed my scAgent on my MongoDB replica members and I’m pointing to the name of my primary server in the configuration.

part2_mdb_cfg_wiz_04

Figure 8. Agent Configuration.

Now is time to let your scServer knows how to talk with your ONTAP cluster. At this point you need to inform which protocol do you want to use to connect to your ONTAP cluster/SVM. Here I’m using HTTP on port 80.

part2_mdb_cfg_wiz_05

Figure 9. Storage Connection Settings.

Now your scServer knows which protocol will be used to talk to ONTAP, but it still needs the connectivity and authentication information to send commands to it. Here you will inform your SVM/Cluster name or IP address and also username and password to connect to it.

part2_mdb_cfg_wiz_06

Figure 10. Controller and SVM Credentials.

scServer now connects to your SVM/Cluster and it will show a list of volumes (left panel) for that particular object. You need to select the volumes that contains your database and click on the “right arrow” button to move them to the right side as shown by figure 11. Then click on “save”.

part2_mdb_cfg_wiz_07

Figure 11. Selecting Your Database Volumes.

After that, Snap Creator shows you the list of volumes that you’ve selected and your credentials for your configuration. Then, click “next”.

part2_mdb_cfg_wiz_08

Figure 12. List of SVM/Cluster and Volumes will be part of your configuration.

Now is time to setup your backup and retention policies. For this example, we are setting up a daily backup policy with retention of 2 days.

part2_mdb_cfg_wiz_09

Figure 13. Backup and retention policy.

Here is the most critical step. As your database is spread across volumes (in my case I have 8 volumes), to backup it properly you need to take a consistency group snapshot. So, at this screen, don’t forget to click on “Consistency Group” check box before to click on “next”.

part2_mdb_cfg_wiz_10

Figure 14. Snapshot Details.

The next screen is about replication and remote backup, SnapMirror and SnapVault respectively. I’m not using any of these two options on my environment, so just click on “next”.

part2_mdb_cfg_wiz_11

Figure 15. SnapMirror and SnapVault.

If you have OnCommand Unified Manager in your environment and wants to let your scServer to send notifications for it, here is where you provide all the connection information to let that happen.

part2_mdb_cfg_wiz_12

Figure 16. NetApp OnCommand Unified Manager settings.

Then a Summary screen and the opportunity to review all your settings before to click on “Finish”.

part2_mdb_cfg_wiz_13

Figure 17. Configuration Summary.

After click on “Finish” your configuration is created and you are ready to create your first MongoDB backup.

part2_mdb_cfg_wiz_14

Figure 18. Configuration created successfully.

To create your first backup, select your configuration on the left panel. Click on “Actions” button and then “Backup”.

part2_mdb_action_backup

Figure 19. Backup your database.

On the next part of this series I will cover restore and cloning operations.

Thanks for reading it and let me know your opinion about this post leaving a comment.

A special thanks for Kevin Adistambha (Technical Service Engineer @ MongoDB). He had answered my questions about fsyncLock() and fsyncUnlock in the mongodb users forum.

See you soon,

Logwriter

References:

WiredTiger Internals

WiredTiger Snapshots and Checkpoints

NetApp Snap Creator Data Sheet